
There are no items in your cart
Add More
Add More
| Item Details | Price | ||
|---|---|---|---|

Introduction
aaj market me heavy volume ke saath spotlight me aaya, jahan stock ne ₹150–₹155 zone ke aas paas strong activity dikhayi. Yeh movement normal nahi hai —
jab bhi kisi stock me sudden high volume + price volatility aata hai,
wahan smart money activity hone ke chances badh jaate hain. Is blog me hum samjhenge:
👉 Volume kyun aaya
👉 Stock me kya chal raha hai
👉 Opportunity hai ya risk
🌍 Dubai / Abu Dhabi Investment Angle
“Agar deal smoothly execute hoti hai, toh long-term rerating possible hai”
Sammaan Capital Ltd. is a holding company, which engages in the operation of financing institutions which specializes in housing finance, real estate, and wealth management. It operates through the Investing and Financing Related Activities; and Fee Income segments. The Investing and Financing Related Activities segment involves in investing and financing related activities in various subsidiaries, financing of loans, and credit activities. The Fee Income segment comprises of financial service related fee from services income, commission on insurance, and other fee based activities. The company was founded by Sameer Gehlaut on May 10, 2005 and is headquartered in Mumbai, India.
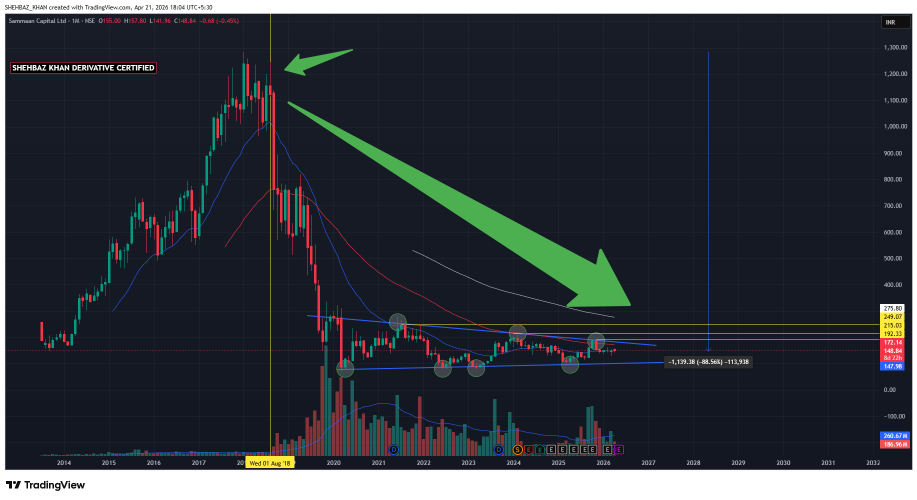
Observation
Yeh ek battle zone hai — buyers vs sellersHigh Volume + Stable Zone = Accumulation ya Distribution phase
if you see the chart on Daily time frame you see a time correction already happen and stock close to 50EMA, 100EMA, 200EMA
Fundamentals Overview
| Parameter | Status | Interpretation |
|---|---|---|
| Business Turnaround | ⚖️ Ongoing | Recovery visible but not fully stable |
| Debt Levels | ❗ High | NBFC risk present |
| Profitability | 📈 Improving | Recent quarters better |
| Valuation | 💰 Undervalued | Trading below book value |
| Market Sentiment | 🟡 Mixed | Trust rebuilding phase |
Monthly Chart
wedge pattern
News of the day
FY26 revenue grew 11.2% YoY to ₹130,144 Crores, with EBIT margin at 17.2% and net income at ₹17,361 Crores. AI-led services and digital transformation drove growth, while Q4 saw softer demand. FY27 guidance projects 1.0%-4.0% revenue growth YoY CC.
Tech Mahindra Limited is expected to report a steady set of numbers for the March quarter, with modest sequential growth in revenue and improvement in margins, according to CNBC-TV18 poll estimates.Revenue in dollar terms is seen rising 0.9% quarter-on-quarter to $1,624 million, while rupee revenue is estimated to grow 2.9% to ₹14,804 crore. Constant currency revenue growth is expected to remain muted at around 0.5% sequentially, reflecting normalisation of one-off gains, including a European auto deal, and seasonal weakness in the BPS segment.Profit after tax is projected to jump 34% sequentially to ₹1,504 crore, while EBIT is expected at ₹2,035 crore. Margins are likely to improve 60 basis points to 13.7%, supported by cost optimisation under 'Project Fortius,' currency tailwinds from rupee depreciation, and increased offshoring.
Educational content 📖
This stock analysis is designed for educational purposes and should not be taken as financial advice. Please carry out your own research or consult with a financial advisor before investing.
{{DATE}}
 Launch your Graphy